Graph It Art/Math
For this project we combined it between Math and Art. For the Art aspect, we made a graphed picture of our choosing out of yarn. For the Math aspect, we had to fill out a webquest to choose an element on the periodic table. Once that element was picked, we had to choose an object of some sort that had that element in it. For math, we've been doing graphs so, we had to graph that picture onto a graph. Next we had to plot our points. After we did a number of equations from those points. Lastly, we went back to all of our points and put yarn through them on a foam board. This created the image we wanted, just very "graphy" looking.
My element was Hydrogen, and I chose this element because I really wanted to do the picture of The Big Wave. Since Hydrogen is in water, I was able to pick that as my image and I got to work! The final image looked very cool, and I really enjoyed this project. I really liked the art part, but also thought it was cool to do all of the graphing aspect with the equations. I thought all of the equations would be difficult, but they seemed to be pretty easy. Two interesting facts about my element are 1. Liquid hydrogen has the lowest density of any liquid. 2. Hydrogen is the most abundant element in the world.
My element was Hydrogen, and I chose this element because I really wanted to do the picture of The Big Wave. Since Hydrogen is in water, I was able to pick that as my image and I got to work! The final image looked very cool, and I really enjoyed this project. I really liked the art part, but also thought it was cool to do all of the graphing aspect with the equations. I thought all of the equations would be difficult, but they seemed to be pretty easy. Two interesting facts about my element are 1. Liquid hydrogen has the lowest density of any liquid. 2. Hydrogen is the most abundant element in the world.
How to make an equation:
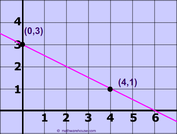
In order to find the equation of a line, you have to start out with 2 points. Next, you find the slope, which is figuring out how big your "triangle between the two coordinates is (below). (This means that lets say the Y axis is the price and the X axis is the year. The slope means that if its 3/4 that means the for every 4 years, the price goes up $3. example) After that, you start putting your algorithm together. The starter for that is Y=MX+B. Y being the Y coordinate, M being the slope, X being the X coordinate, and B being the y-intercept (what your trying to figure out). Next thing is picking out one of the two coordinates you have. This part doesn't matter which one you pick, and then next you will replace the X and Y with the X and Y coordinates of the coordinate you picked out. Now that you have that, you need to find what B equals. To do that, you must next multiplied your slope and X together. Once you have reached that point, you must get B by itself. So, you subtract or add what you just multiplied to the Y. After that you are left with your answer to B. But, your not done yet; the following step would be make it into an equation, that being Y=(slope)(X)+(answer to B).
D= Domain- X axis possible values; if there are 2 coordinates, (2,3) (5,8) the domain would be [2,5]
R= Range- Y axis possible values; if there are 2 coordinates, (2,3) (5,8) the range would be [3,8]
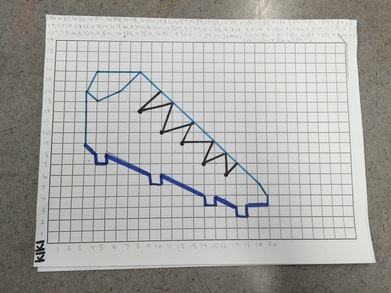
Graph It Art Drawing:
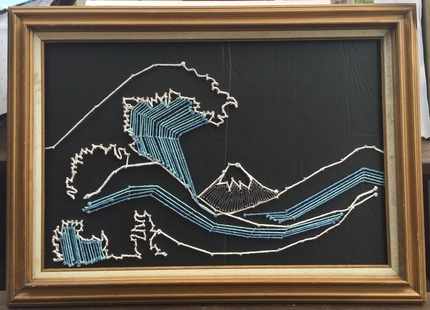
Graph It Art Final Piece:
Artist Statement:
My element was Hydrogen for this project. One fact about my element is, liquid hydrogen has the lowest density of any liquid. The second fact is that, hydrogen is the most abundant element in the world.
My element connects with my art because hydrogen is in water. My actual are is a wave, which is made up of water.
I chose the colors of yarn that I used because i wanted a flow. I chose the greys and white because I wanted to make it blend with the black background. I chose the blues because I wanted a pop of color.
My experience with the project was overall very fun. I really liked actually making the art, although the graphing/plotting took a little while longer.
